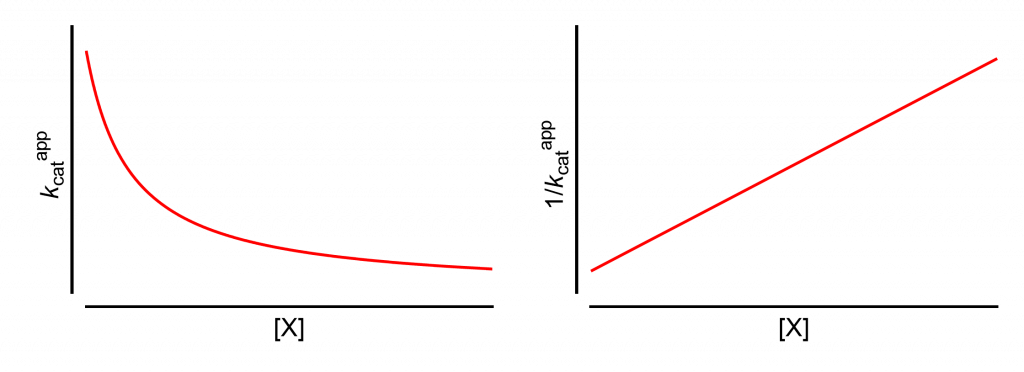
The analysis of your data shows that kcat decreases as hyperbola and 1/kcat increases as straight line when the concentration of modifier increases, namely
This property is shared by four linear inhibition mechanisms. Two of them (the left and right choices below) can be identified just by examining the dependence of Km on modifier concentration, [X].
For the subgroup ‘Km decreases as hyperbola’ (the choice in the middle) discrimination is made by further examining how kcat/Km varies with [X]. Click the appropriate statement to unravel the mechanism.
Km increases as hyperbola
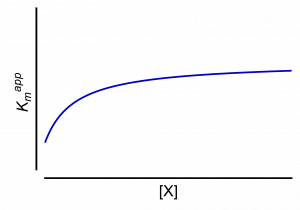
The sought mechanism is:
Linear mixed, predominantly specific inhibition, LMx(Sp>Ca)I
Km decreases as hyperbola
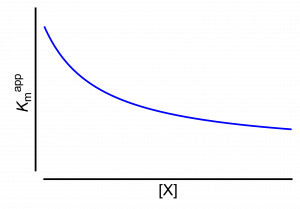
Two mechanisms share this property. They can be distinguished by examining the dependence of kcat/Km on modifier concentration.
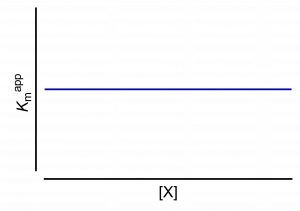
Km does not depend on modifier concentration